How to Automate Social Media Reporting with n8n + Google Sheets
Build an automated social media reporting pipeline with n8n and Google Sheets. Pull data from LinkedIn, Instagram, and X APIs daily, aggregate in Sheets, and auto-generate weekly summaries.
How to Automate Social Media Reporting with n8n + Google Sheets
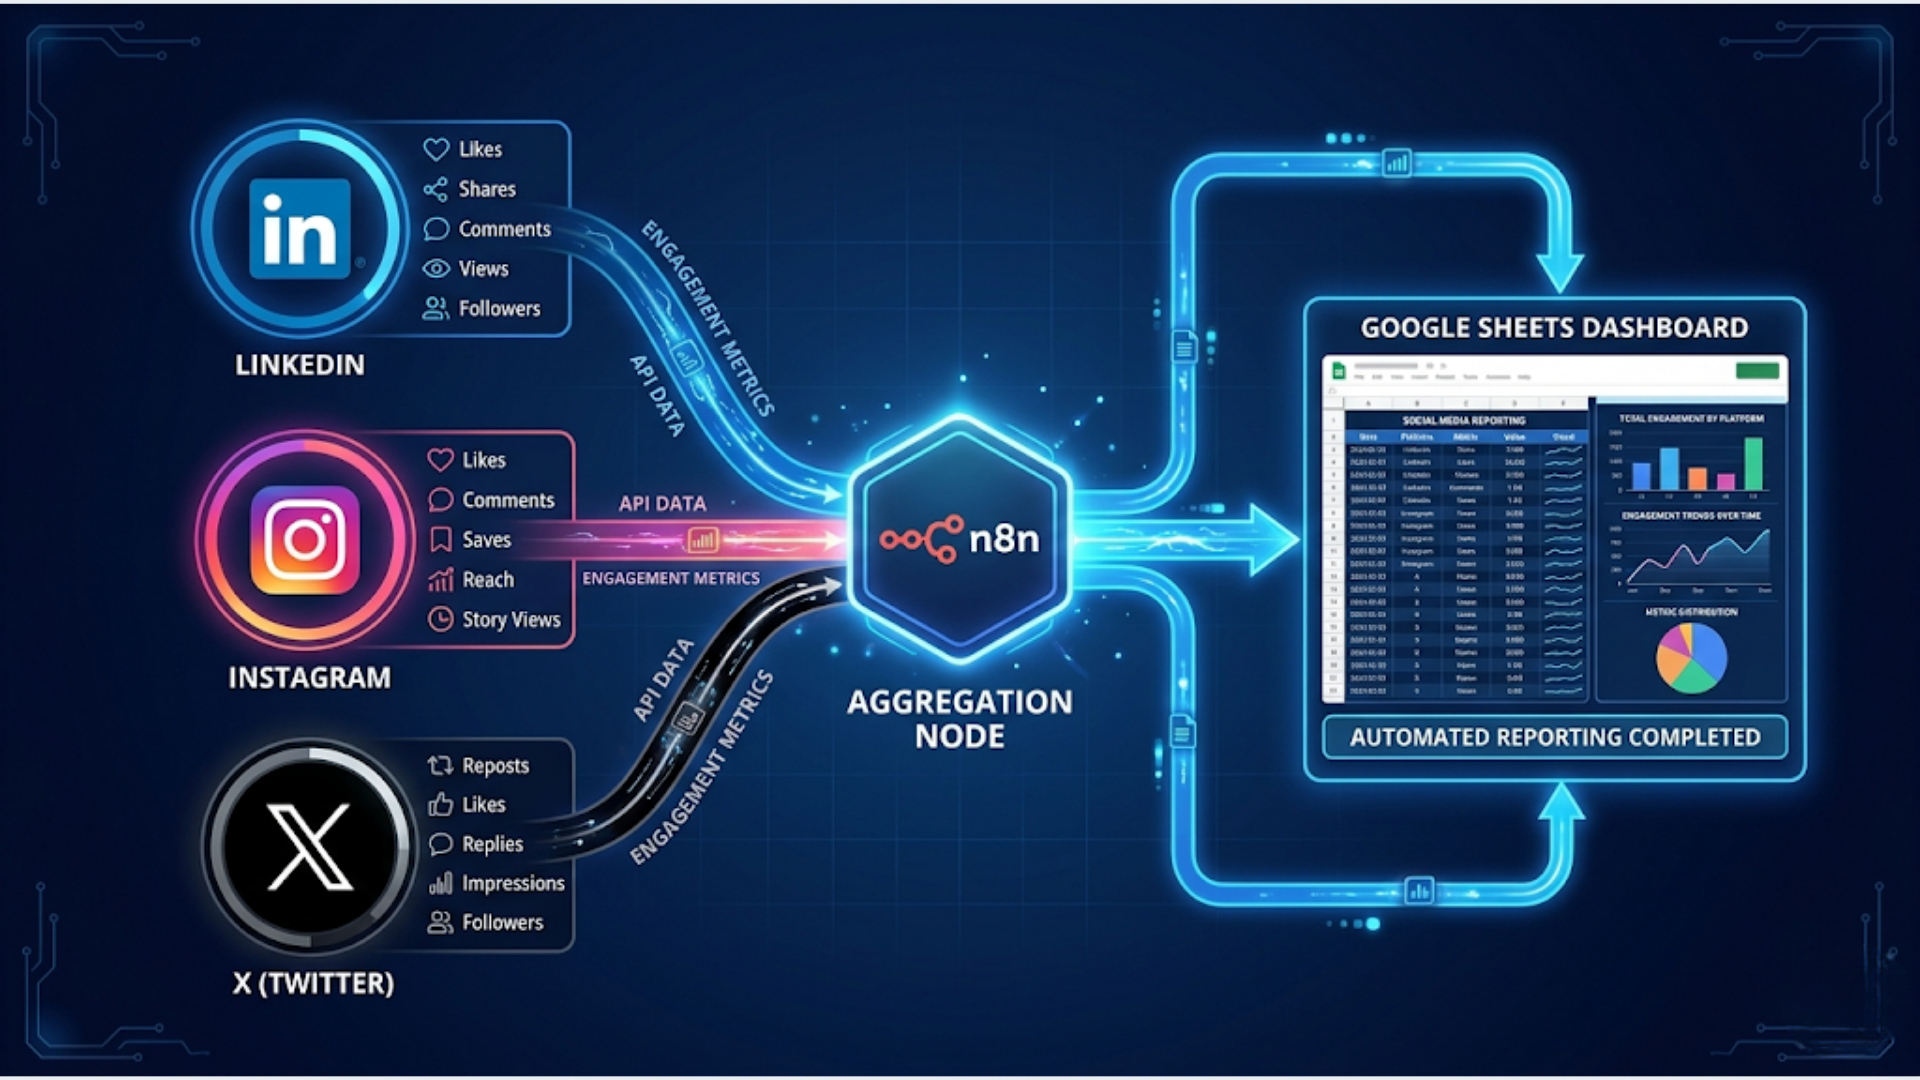
An automated social media reporting pipeline pulls engagement data from LinkedIn, Instagram, and X daily, aggregates it in Google Sheets, and generates a weekly summary, saving 3-5 hours per week of manual screenshot-and-spreadsheet work. The system runs on n8n with zero daily intervention.
I build these systems. The manual version looks the same everywhere: someone logs into each platform on Monday morning, screenshots the analytics dashboard, copies numbers into a spreadsheet, calculates week-over-week changes, and pastes it into a report. By the time the report is done, it’s already outdated. Automation makes the data continuous and the reports instant.
Here’s how to build the complete pipeline.
Why Manual Social Media Reporting Wastes Time
The average social media manager spends 4-6 hours per week compiling reports. For agencies managing multiple clients, multiply that by the number of accounts. It’s pure data entry work that adds zero strategic value.
The manual process typically looks like this:
- Log into LinkedIn Creator Analytics. Screenshot. Copy numbers.
- Log into Instagram Insights. Screenshot. Copy numbers.
- Log into X Analytics. Screenshot. Copy numbers.
- Open Google Sheets. Enter all numbers. Calculate changes.
- Format a report. Add commentary. Send to stakeholders.
Time breakdown:
| Task | Manual Time (per platform) | Automated |
|---|---|---|
| Log in and navigate to analytics | 3-5 min | 0 (API call) |
| Copy metrics to spreadsheet | 5-10 min | 0 (auto-populate) |
| Calculate week-over-week changes | 10-15 min | 0 (formula) |
| Format and send report | 15-30 min | 2 min (review auto-generated) |
| Total for 3 platforms | 1.5-3 hours | 2 minutes of review |
The hidden cost isn’t just time. It’s consistency. When reports are manual, some weeks they get skipped. Data gaps make trend analysis impossible. A daily automated pull means you never have missing data points, even when someone’s on vacation or swamped with other work.
The Architecture: Daily Pull, Weekly Report
The system has two workflows running independently.
Workflow 1: Daily Data Pull (runs at 7 AM daily) Connects to each platform’s API, pulls yesterday’s metrics, and appends them to a Google Sheet. One row per day per platform.
Workflow 2: Weekly Report Generator (runs Monday at 8 AM) Reads the last 7 days from the Google Sheet, calculates aggregates and changes, generates a summary, and sends it via email or Slack.
The Google Sheet structure:
Create a spreadsheet with one tab per platform:
LinkedIn tab columns: Date | Followers | New Followers | Post Impressions | Post Engagements | Engagement Rate | Profile Views | Top Post URL | Top Post Impressions
Instagram tab columns: Date | Followers | New Followers | Reach | Impressions | Profile Visits | Story Views | Reels Plays | Top Post URL | Top Post Engagement
X (Twitter) tab columns: Date | Followers | New Followers | Impressions | Engagements | Engagement Rate | Profile Visits | Top Tweet URL | Top Tweet Impressions
Summary tab: Auto-calculated from the platform tabs using formulas. Weekly totals, averages, and week-over-week deltas.
Step 1: Connect LinkedIn Analytics API
LinkedIn’s API requires an OAuth2 app with the right permissions. This is the trickiest platform to set up because LinkedIn’s API access is more restricted than other platforms.
Setup requirements:
- A LinkedIn Page (company page, not personal profile) or Creator Mode enabled on personal profile
- A LinkedIn app in the Developer Portal (linkedin.com/developers)
- OAuth2 credentials with
r_organization_socialandr_organization_adminscopes (for company pages) orr_liteprofileand Marketing APIs for personal profiles
In n8n:
- Add an HTTP Request node
- Set up OAuth2 credentials for LinkedIn
- Call the LinkedIn Analytics API endpoint:
- For company page:
GET /organizationalEntityShareStatistics?q=organizationalEntity&organizationalEntity=urn:li:organization:{org_id}&timeIntervals.timeGranularityType=DAY&timeIntervals.timeRange.start={yesterday_timestamp}&timeIntervals.timeRange.end={today_timestamp} - For personal profile posts:
GET /ugcPosts?q=authors&authors=List(urn:li:person:{person_id})&count=10
- For company page:
Metrics to pull daily:
- Total followers (from
/organizationPageStatistics) - New followers (today’s count minus yesterday’s from your Sheet)
- Post impressions and engagements (from
/organizationalEntityShareStatistics) - Individual post performance for posts published yesterday
The LinkedIn API limitation: LinkedIn’s API access is restrictive. If you can’t get Marketing API approval, an alternative approach works: use n8n’s HTTP Request node to call LinkedIn’s public-facing analytics endpoints that your browser uses. This is less reliable long-term but works for personal accounts without Marketing API access.
Practical alternative: For teams that can’t access the LinkedIn API, a semi-automated approach works. Use LinkedIn’s built-in “Export analytics” feature (available on Creator Mode and Company pages). Schedule a weekly calendar reminder to export the CSV. An n8n workflow watches a Google Drive folder for new CSV uploads, parses the data, and appends it to the master Sheet. Not fully automatic, but eliminates the manual data entry.
Step 2: Connect Instagram Graph API
Instagram’s Graph API (via Facebook/Meta) is more accessible than LinkedIn’s but requires a Facebook App and connected Instagram Business or Creator account.
Setup requirements:
- Instagram Business or Creator account (switch from personal in Instagram settings)
- A Facebook Page connected to the Instagram account
- A Facebook App in Meta Developer Portal
- Access token with
instagram_basicandinstagram_manage_insightspermissions
In n8n:
- Add an HTTP Request node
- Configure with the Instagram Graph API base URL:
https://graph.facebook.com/v19.0/ - Use your access token as a query parameter
API calls for daily metrics:
Account-level insights:
GET /{ig_user_id}/insights?metric=impressions,reach,follower_count,profile_views&period=day&since={yesterday}&until={today}Recent media performance:
GET /{ig_user_id}/media?fields=id,caption,media_type,timestamp,like_count,comments_count,impressions,reach&limit=10Stories insights (if applicable):
GET /{ig_user_id}/stories?fields=id,timestamp,impressions,reach,repliesToken refresh: Instagram access tokens expire. Long-lived tokens last 60 days. Add a scheduled workflow that refreshes the token before expiry:
GET /oauth/access_token?grant_type=fb_exchange_token&client_id={app_id}&client_secret={app_secret}&fb_exchange_token={current_token}Store the refreshed token in a Google Sheet or n8n credentials. This prevents the workflow from breaking every 60 days.
Reels metrics: Reels are increasingly important for Instagram reach. Pull Reels-specific metrics:
GET /{media_id}/insights?metric=plays,reach,likes,comments,shares,savedFilter media by type (VIDEO with product type REELS) to separate Reels performance from regular post performance in your report.
Step 3: Connect X (Twitter) API
X’s API has undergone significant changes. The free tier (Basic) provides limited access. The Pro tier ($100/month) provides full analytics access. Here’s what works at each tier.
Free/Basic tier approach:
The free tier doesn’t include analytics endpoints. But you can still track your own posts:
- Use the
GET /2/users/{id}/tweetsendpoint to pull your recent tweets - Each tweet object includes
public_metrics: retweet_count, reply_count, like_count, quote_count, impression_count - Pull the last 10-20 tweets daily and compare to previous day’s numbers to calculate engagement deltas
Pro tier approach ($100/month):
With Pro, you get full access to the analytics endpoints:
GET /2/users/{id}?user.fields=public_metricsReturns: followers_count, following_count, tweet_count, listed_count
For post analytics:
GET /2/tweets?ids={tweet_ids}&tweet.fields=public_metrics,organic_metricsIn n8n:
- Add an HTTP Request node
- Set authentication to OAuth2 or Bearer Token (depending on your app type)
- Configure the endpoint URL with your user ID
- Parse the response with a Set node to extract the metrics you need
Daily pull structure:
{
  "date": "2026-04-26",
  "followers": 12450,
  "new_followers": 23,
  "impressions_today": 15200,
  "engagements_today": 342,
  "engagement_rate": "2.25%",
  "top_tweet_url": "https://x.com/username/status/123456",
  "top_tweet_impressions": 5400
}
Each day’s data appends to the X tab in your Google Sheet.
Step 4: Aggregate and Calculate in Google Sheets
The daily pull workflows populate the Sheet. Now make the data useful with calculations.
Summary tab formulas:
For each platform, create a summary section that auto-calculates:
This week’s total impressions (LinkedIn):
=SUMPRODUCT((LinkedIn!A:A>=TODAY()-7)*(LinkedIn!A:A<TODAY())*LinkedIn!D:D)Week-over-week follower growth:
=INDEX(LinkedIn!B:B,MATCH(TODAY()-1,LinkedIn!A:A,0)) - INDEX(LinkedIn!B:B,MATCH(TODAY()-8,LinkedIn!A:A,0))Average engagement rate (last 7 days):
=AVERAGEIFS(LinkedIn!F:F,LinkedIn!A:A,">="&TODAY()-7,LinkedIn!A:A,"<"&TODAY())Cross-platform summary row:
| Metric | X | Total | ||
|---|---|---|---|---|
| Impressions (7d) | =formula | =formula | =formula | =SUM |
| Engagement Rate (7d avg) | =formula | =formula | =formula | =AVG |
| New Followers (7d) | =formula | =formula | =formula | =SUM |
| Top Post (by engagement) | =formula | =formula | =formula | - |
Conditional formatting:
Add color coding to the week-over-week change columns. Green for positive growth, red for decline. This makes the report scannable at a glance. Format engagement rates above your benchmark in green, below in yellow/red.
Step 5: Auto-Generate and Distribute the Weekly Report
The second n8n workflow runs every Monday at 8 AM.
Node 1: Cron Trigger - Monday 08:00
Node 2: Read Google Sheets - Pull last 14 days of data (this week + last week for comparison)
Node 3: Calculate summary - Code node that computes:
- Total impressions per platform (this week vs last week, % change)
- Total engagements per platform (this week vs last week, % change)
- Follower growth per platform
- Top performing post per platform (by engagement)
- Cross-platform totals
Node 4: Generate summary text - Use GPT-4 or a template to create a readable summary.
A template approach (no AI needed for this):
Weekly Social Media Report: {start_date} - {end_date}

HIGHLIGHTS
- Total reach across platforms: {total_impressions} ({change_pct}% vs last week)
- New followers: {total_new_followers} (LinkedIn: {ln_new}, Instagram: {ig_new}, X: {x_new})
- Top post: {top_post_url} with {top_engagement} engagements

LINKEDIN
Impressions: {ln_impressions} ({ln_change}%)
Engagements: {ln_engagements} (Rate: {ln_rate}%)
Followers: {ln_followers} (+{ln_new})

INSTAGRAM
Reach: {ig_reach} ({ig_change}%)
Engagements: {ig_engagements} (Rate: {ig_rate}%)
Followers: {ig_followers} (+{ig_new})

X (TWITTER)
Impressions: {x_impressions} ({x_change}%)
Engagements: {x_engagements} (Rate: {x_rate}%)
Followers: {x_followers} (+{x_new})

TOP PERFORMING CONTENT
1. {post_1_url} - {post_1_metric}
2. {post_2_url} - {post_2_metric}
3. {post_3_url} - {post_3_metric}
Node 5: Distribute - Send the report via:
- Email (Gmail node) to stakeholders
- Slack (Slack node) to a #social-media channel
- Both (run in parallel)
For agencies managing multiple clients, loop through a client list and generate one report per client, each pulling from the client-specific tabs in their Sheet.
India-Specific Considerations
For Indian brands and agencies, social media reporting has some unique requirements.
WhatsApp Business metrics: WhatsApp is a major marketing channel in India, especially for D2C brands. The WhatsApp Business API (via WATI, Interakt, or direct) provides broadcast analytics: delivered, read, replied, and link clicks. Add a WhatsApp tab to your reporting Sheet. Pull metrics from WATI’s API using n8n’s HTTP Request node. Include in the weekly report alongside LinkedIn/Instagram/X. Metrics to track: broadcast sent, delivered rate, read rate, reply rate, and opt-out rate.
Regional platform usage patterns: Instagram and YouTube dominate in Indian metros. X usage is lower than global averages but matters for B2B and tech audiences. Include YouTube analytics if video is part of the content strategy (YouTube Data API is well-supported in n8n). For brands targeting Tier 2/3 cities, track ShareChat or Josh if relevant.
Festive season benchmarking: Indian social media engagement spikes during Diwali, Navratri, Christmas, Independence Day, and IPL season. Your weekly reports should flag when a metric spike is seasonal vs organic. Add a “seasonality note” field. If engagement jumps 40% during IPL season, that’s not the same as 40% organic growth. Manual annotation helps prevent misinterpretation.
Instagram Shopping and Razorpay attribution: Indian D2C brands using Instagram Shopping need to track not just engagement but revenue attribution. If you use Razorpay for payments and have UTM tracking, add a conversion column: how many sales originated from Instagram content this week? Pull Razorpay payment data filtered by UTM source using the Razorpay API.
Agency reporting at scale: Indian digital marketing agencies typically manage 10-30 client accounts. The workflow scales by parameterizing the client: one master workflow with a client ID input, pulling from client-specific credential sets and Sheet tabs. Create a “client config” Sheet that maps each client to their platform credentials, report recipients, and Sheet IDs. The weekly report workflow loops through all clients.
Cost for Indian agencies: Running this for 10 clients: n8n Cloud ($20/month), OpenAI for report summaries ($5/month), Google Sheets (free). Total: roughly INR 2,000-2,500/month. That replaces 30-50 hours of manual reporting per month across clients. For a single brand, the n8n Cloud cost is the only significant expense.
FAQ
How do I automate social media reporting for free? n8n self-hosted is free. Google Sheets is free. The platform APIs (LinkedIn, Instagram, X) are free at basic tiers. The only cost is hosting n8n, which you can run on a $5/month VPS or even a Raspberry Pi. Total cost: $0-5/month. The limitation is API access. Instagram and X’s free tiers have rate limits and restricted metrics. LinkedIn’s API requires approval. For a zero-cost start, use the semi-automated approach: export CSV from each platform weekly and let n8n parse and aggregate.
Which social media metrics should I track? Track these core metrics per platform: follower count, follower growth, total impressions/reach, total engagements, engagement rate, and top-performing post. These six metrics tell the story of growth (followers), visibility (impressions), and impact (engagement). Add platform-specific metrics as needed: Reels plays for Instagram, profile views for LinkedIn, reply depth for X.
Can n8n pull data from LinkedIn Analytics? Yes, but with caveats. LinkedIn’s API requires a LinkedIn App with Marketing API access, which requires approval. For company pages, the Organization Analytics endpoints provide detailed data. For personal profiles, access is more limited. If you can’t get API approval, use LinkedIn’s CSV export feature and automate the parsing step with n8n watching a Google Drive folder for new exports.
How do I track social media ROI, not just engagement? Add UTM parameters to every link you share on social media. Track conversions in Google Analytics or your payment processor (Stripe, Razorpay). In your reporting Sheet, add a revenue or conversion column alongside engagement metrics. n8n can pull Google Analytics data via the GA4 API and Stripe revenue data via the Stripe API. Match UTM sources to social platforms for attribution.
How often should the reporting workflow run? Daily data pulls, weekly reports. The daily pull ensures no data gaps (some platforms only retain detailed analytics for 30-90 days). The weekly report cadence matches how most teams make content decisions. For agencies with demanding clients, add a monthly deep-dive report that includes 30-day trends and benchmarks.
Can I add YouTube reporting to the same workflow? Yes. YouTube’s Data API is well-documented and n8n supports it. Add a YouTube tab to your Sheet. Pull daily metrics: views, watch time, subscribers gained/lost, top video performance. The API requires a Google Cloud project with YouTube Data API enabled and OAuth2 credentials. The n8n workflow is the same pattern: daily pull, append to Sheet, include in weekly report.
Need help implementing this?
Book a free 30-minute discovery call. We'll map your current setup, identify quick wins, and outline what automation can do for your business.
Book a Free Discovery Call