How to Automate Project Status Reporting in Slack
Automate project status reports in Slack using n8n. Pull data from Notion, Asana, ClickUp, or Monday, format with Block Kit, and deliver scheduled weekly digests with drill-down buttons.
How to Automate Project Status Reporting in Slack
Every Monday morning, someone on your team spends 30-60 minutes writing a status update. They open the project management tool, check what’s done, what’s in progress, what’s blocked. Then they format it nicely in Slack and post it. Every single week.
That’s 2-4 hours per month per project. If you manage 5 projects, that’s 10-20 hours monthly on status reporting. Time that produces no actual work product. Just information transfer from one system to another.
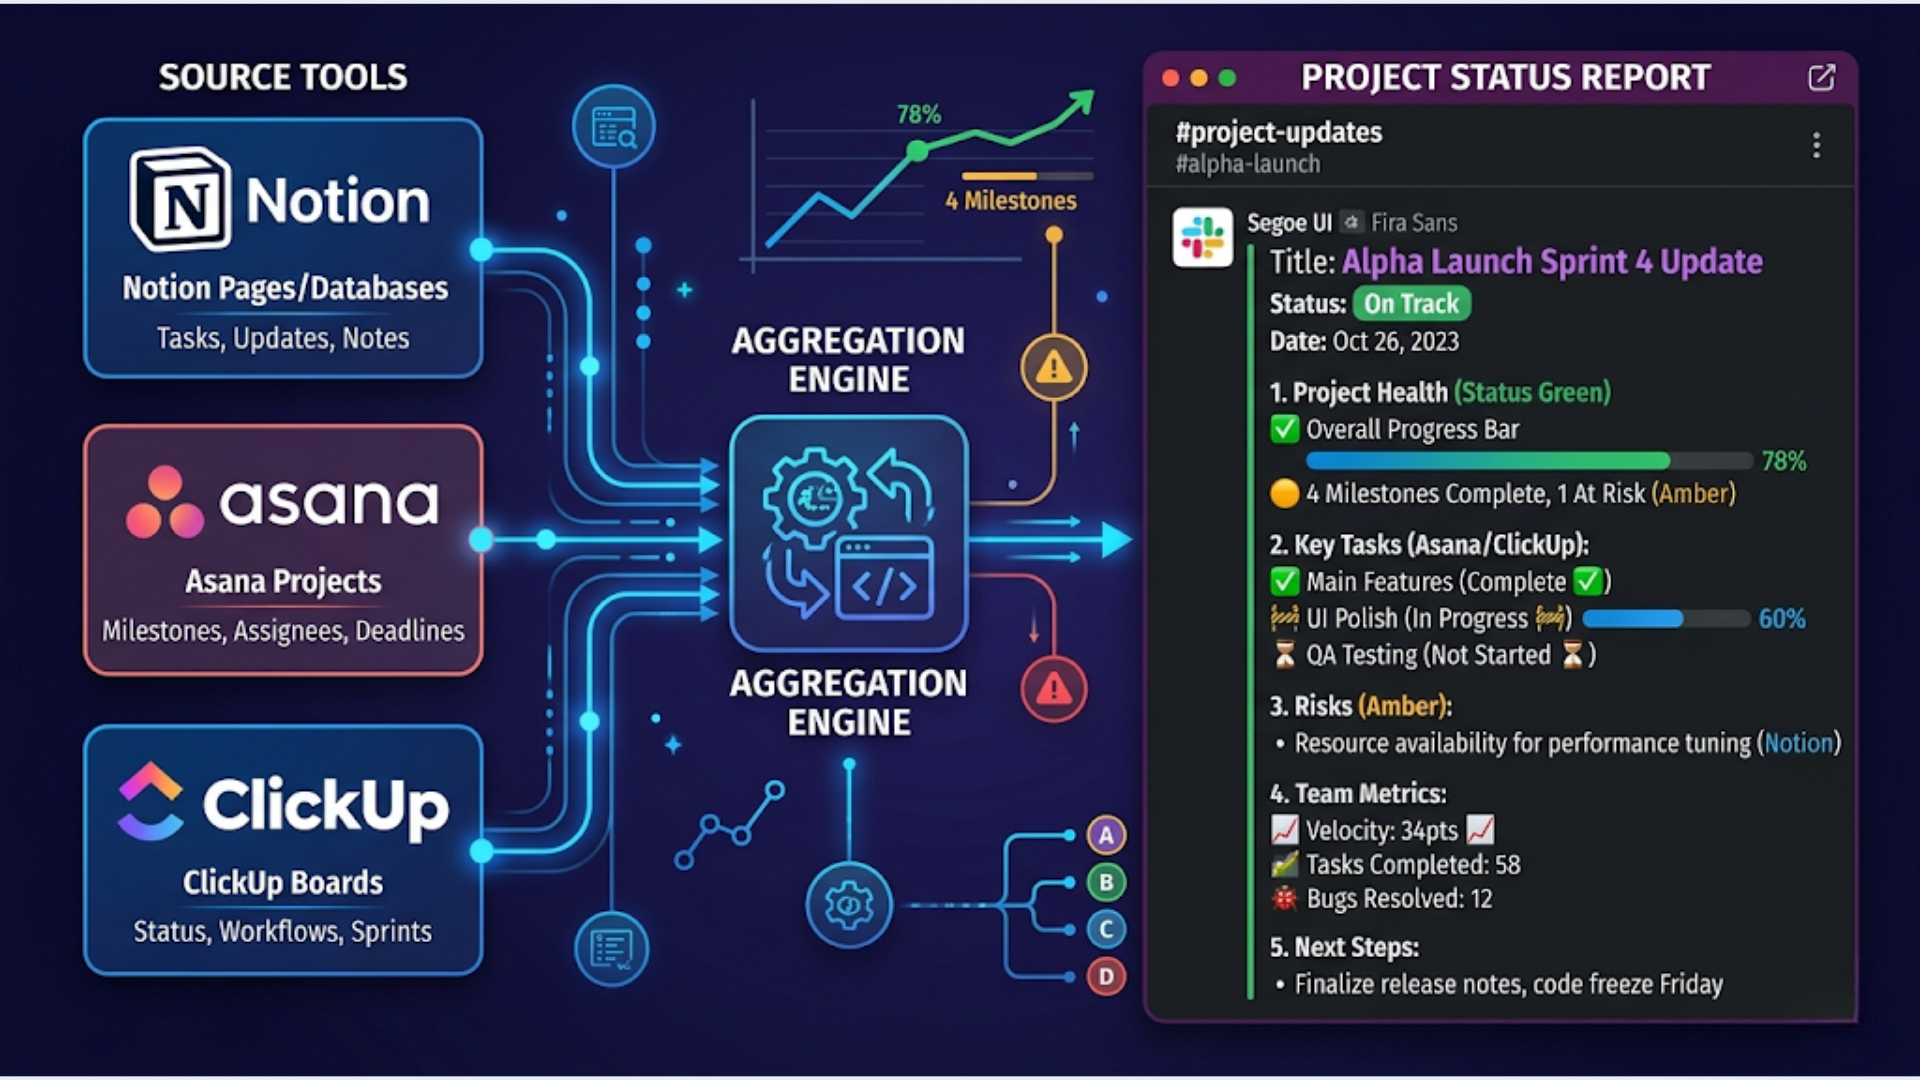
An automated status report pulls data from your project tool, formats it as a clean Slack message, and posts it on schedule. No human writes it. No human sends it. The team reads it, asks questions, and moves on. I build these systems. Here’s the complete setup.
What a Good Automated Status Report Contains
Before automating, define what belongs in the report. Too much detail and nobody reads it. Too little and it’s useless.
The format that works:
PROJECT STATUS: [Project Name]
Week of April 21-26, 2026

COMPLETED THIS WEEK (5)
  Task 1 (assigned to, completed date)
  Task 2 ...

IN PROGRESS (3)
  Task 3 (assigned to, due date, % complete)
  Task 4 ...

BLOCKED (1)
  Task 5 (blocker description, blocked since date)

UPCOMING NEXT WEEK (4)
  Task 6 (assigned to, due date)
  Task 7 ...

METRICS
  Tasks completed: 5/8 planned (62.5%)
  On-time delivery: 4/5 (80%)
  Blockers resolved: 2
  New blockers: 1

RISK FLAG: [Project Name] has 1 unresolved blocker for 3+ days
Key principles:
- Lead with what got done (positive momentum)
- Highlight blockers prominently (action required)
- Include metrics (trends over time tell the real story)
- Risk flags when something needs attention
- Keep it scannable. No paragraphs. Bullet points only.
Pulling Data from Project Management Tools
Each project tool has its own API. Here’s how to extract status data from the major ones.
Notion
Notion’s database API is the most flexible for status reporting. If your tasks live in a Notion database with properties like Status, Assignee, Due Date, and Project, n8n can query everything.
n8n node setup:
-
Notion node: Query database with filters
- Filter 1: Status = “Done” AND Last Edited > 7 days ago (completed this week)
- Filter 2: Status = “In Progress” (active work)
- Filter 3: Status = “Blocked” (needs attention)
- Filter 4: Due Date within next 7 days AND Status != “Done” (upcoming)
-
For each filter result, extract: Title, Assignee (person property), Due Date, Status.
Notion API rate limit: 3 requests per second. For a report pulling 4 filtered queries from one database, that’s about 2 seconds. No issues.
Notion-specific tip: Use a “Last Status Change” date property (updated via automation when Status changes). This lets you calculate how long something has been blocked, not just that it is blocked.
Asana
Asana’s API uses project sections and custom fields for status tracking.
n8n node setup:
- HTTP Request:
GET /projects/{project_id}/tasks?completed_since=2026-04-19(completed this week) - HTTP Request:
GET /projects/{project_id}/tasks?opt_fields=name,assignee.name,due_on,custom_fieldswith filter for incomplete tasks - Parse custom field “Status” or section membership to categorize (In Progress, Blocked)
Asana API rate limit: 150 requests per minute. Plenty for reporting.
ClickUp
ClickUp’s API provides task data with status, assignees, and time tracking.
n8n node setup:
- HTTP Request:
GET /list/{list_id}/task?statuses[]=complete&date_updated_gt={week_start_timestamp}(completed this week) - HTTP Request:
GET /list/{list_id}/task?statuses[]=in progress(active) - HTTP Request:
GET /list/{list_id}/task?statuses[]=blocked(blocked)
ClickUp-specific advantage: ClickUp’s API returns time tracking data. You can include “time spent this week” in the status report, giving visibility into effort allocation.
Monday.com
Monday’s API is GraphQL-based.
n8n node setup:
- HTTP Request (POST to
https://api.monday.com/v2):
{
  boards(ids: [BOARD_ID]) {
    items_page(limit: 100) {
      items {
        name
        column_values {
          id
          text
          value
        }
      }
    }
  }
}- Parse column values to extract status, assignee, due date, and timeline.
Monday-specific note: Column IDs are random strings, not human-readable names. Map them during setup. The first query will tell you which column ID corresponds to “Status”, “Person”, “Date”, etc.
Multi-Tool Aggregation
Many teams use multiple tools. Design team in Figma tasks. Dev team in ClickUp. Marketing in Notion. The automated report should aggregate across all of them.
n8n handles this with parallel HTTP requests:
- Notion query (design tasks)
- ClickUp query (dev tasks)
- Notion query (marketing tasks)
- Merge all results into a unified format
- Sort by project, then by status category
The merge step normalizes different data formats. Notion calls it “In progress”, ClickUp calls it “in progress”, Monday calls it “Working on it”. Map them all to a standard set: Done, In Progress, Blocked, Upcoming.
Formatting with Slack Block Kit
Plain text status reports look amateur. Slack Block Kit makes them professional and interactive.
Block Kit structure for a status report:
{
  "blocks": [
    {
      "type": "header",
      "text": {
        "type": "plain_text",
        "text": "Project Alpha - Weekly Status"
      }
    },
    {
      "type": "context",
      "elements": [
        {
          "type": "mrkdwn",
          "text": "Week of Apr 21-26, 2026 | Auto-generated"
        }
      ]
    },
    {
      "type": "divider"
    },
    {
      "type": "section",
      "text": {
        "type": "mrkdwn",
        "text": "*Completed This Week (5)*\n:white_check_mark: Homepage redesign - @sarah\n:white_check_mark: API endpoint testing - @mike\n:white_check_mark: Payment flow update - @priya"
      }
    },
    {
      "type": "section",
      "text": {
        "type": "mrkdwn",
        "text": "*Blocked (1)*\n:octagonal_sign: Database migration - waiting on DevOps approval (3 days)"
      }
    },
    {
      "type": "actions",
      "elements": [
        {
          "type": "button",
          "text": {
            "type": "plain_text",
            "text": "View Full Report"
          },
          "url": "https://notion.so/project-report"
        },
        {
          "type": "button",
          "text": {
            "type": "plain_text",
            "text": "View Blocked Items"
          },
          "url": "https://notion.so/blocked-filter"
        }
      ]
    }
  ]
}
n8n builds this JSON dynamically. The template is static. The task data fills in. Each completed task becomes a line item with a checkmark emoji and assignee mention. Each blocked task gets a stop sign and blocker duration.
Slack message limits to know:
- Maximum 50 blocks per message
- Maximum 3,000 characters per text block
- Maximum 5 buttons per actions block
- Maximum 4,000 character limit for the entire message text
For large projects with 20+ tasks per category, truncate and link to the full report. “Showing 10 of 23 completed tasks. [View all in Notion]“
Interactive Buttons for Drill-Down
Static reports answer “what happened.” Interactive buttons answer “tell me more.”
Button options:
| Button | Action | Implementation |
|---|---|---|
| View Full Report | Opens Notion/Asana page | Simple URL button |
| View Blocked Items | Opens filtered view | URL with filter params |
| Request Detail | Triggers a threaded reply with more info | n8n webhook + Slack API |
| Acknowledge | Team lead marks as reviewed | n8n webhook updates tracking sheet |
| Escalate Blocker | Sends DM to the blocker’s owner | n8n webhook + Slack DM |
Interactive buttons require a Slack app. Simple URL buttons work with incoming webhooks. Interactive buttons that trigger actions need a Slack app with interactivity enabled. n8n receives the button click via webhook, processes the action, and responds.
Threaded drill-down example: Manager clicks “Detail: Database Migration” button. n8n receives the interaction, queries the project tool for the full task details (description, comments, activity log), and posts a threaded reply under the status report with the complete context. The manager gets depth without the report getting cluttered.
Scheduling: When and How Often
Weekly reports (most common):
- Monday 9:00 AM: Status of what happened last week + what’s planned this week
- n8n Schedule Trigger node: CRON expression
0 9 * * 1(every Monday at 9 AM) - Adjust for timezone. IST is UTC+5:30, so
0 3 * * 1in UTC for a 9 AM IST delivery
Daily reports (for active sprints):
- Every weekday at 9:00 AM: Yesterday’s progress + today’s plan
- CRON:
0 9 * * 1-5 - Keep daily reports shorter. Only: completed yesterday, starting today, blocked.
Client-level reports (for agencies):
- Weekly or biweekly, sent to a client-specific Slack channel or via email
- Same data, different formatting. Remove internal notes. Add professional language.
- n8n can post to Slack for internal team and simultaneously email a formatted version to the client.
Event-triggered reports (real-time alerts): Not a scheduled report, but a complementary system. When a task gets marked “Blocked”, immediately post to a #blockers channel. Don’t wait for the weekly report. Blockers need attention within hours, not days.
n8n workflow for blocker alerts:
- Project tool webhook fires when status changes to “Blocked”
- n8n checks if blocker has been active for more than specified threshold
- Posts to #blockers channel with task details and assigned person
- If unresolved after 24 hours, escalates with a DM to the project lead
Team-Level vs Client-Level Reports
Team-level reports include everything: individual task assignments, blockers with names, internal metrics, candid status notes. Posted in internal team channels.
Client-level reports are filtered. No internal drama. No individual blame. Focus on deliverables and milestones.
| Element | Team Report | Client Report |
|---|---|---|
| Individual assignees | Yes | No (just “the team”) |
| Blocker details | Full context | ”Minor delay, expected resolution by [date]“ |
| Internal metrics | All | Only relevant KPIs |
| Risk flags | Candid | Diplomatically worded |
| Next steps | Task-level | Milestone-level |
| Tone | Direct | Professional |
n8n handles both from the same data source. One workflow queries the project tool. A Switch node routes to two different formatting templates. Team report goes to #team-project-alpha. Client report goes to #client-alpha or gets emailed as a PDF.
PDF generation for client reports: n8n can generate PDFs using HTML-to-PDF services (PDFShift, or a self-hosted Puppeteer instance). The client gets a branded PDF attached to an email. Professional and archivable.
Advanced: Trend Tracking Over Time
A single status report is a snapshot. Trend tracking over weeks shows patterns.
Store weekly metrics in a Google Sheet:
| Week | Tasks Planned | Tasks Completed | Completion Rate | Blockers | Avg Blocker Duration |
|---|---|---|---|---|---|
| Apr 7 | 8 | 6 | 75% | 2 | 1.5 days |
| Apr 14 | 10 | 8 | 80% | 1 | 0.5 days |
| Apr 21 | 8 | 5 | 62.5% | 3 | 2.3 days |
n8n appends to this sheet every time a weekly report runs. After 4+ weeks, you have enough data to spot trends.
Include a trend line in the Slack report:
TREND (last 4 weeks):
Completion: 75% → 80% → 62.5% ↓ (declining)
Blockers: 2 → 1 → 3 ↑ (increasing)
Action: Blocker count trending up. Review in standup.
This transforms the status report from “what happened” to “what’s changing.” A declining completion rate over 3 weeks is a signal. An increasing blocker count is a pattern. The report flags it before anyone has to notice.
Chart generation: For visual trend reports, n8n can generate charts using QuickChart.io (free API). Pass data, get back a chart image URL. Embed the chart image in the Slack message. One line of trend data becomes a visual that tells the story instantly.
Cost and Setup Time
Total cost:
| Component | Monthly Cost |
|---|---|
| n8n (self-hosted) | $5-10 |
| Slack workspace | Free (or existing) |
| Project tool API | Free (included in plan) |
| QuickChart (optional) | Free |
| Total | $5-10/month |
Setup time:
- Basic weekly report (one project, one tool): 4-6 hours
- Multi-project, multi-tool: 8-12 hours
- Client-level PDF reports: +4-6 hours
- Interactive drill-down buttons: +3-4 hours
- Trend tracking: +2-3 hours
A full-featured system with all the bells: 20-30 hours of setup. That’s a one-time investment that saves 10-20 hours per month on manual reporting. Payback period: 1-3 months.
Frequently Asked Questions
Can I automate status reports without Slack? Yes. The same n8n workflow can deliver via email (formatted HTML), Microsoft Teams (webhook), Discord (webhook), or even WhatsApp (for client updates). Slack is the most common channel but the data aggregation and formatting logic is channel-agnostic.
What if my project tool doesn’t have an API? Most modern tools do (Notion, Asana, ClickUp, Monday, Jira, Linear, Basecamp). If yours doesn’t, check if it exports data to Google Sheets or has a Zapier integration. n8n can pull from either. Absolute last resort: screen scraping, but that’s fragile.
How do I handle multiple projects in one Slack channel? Two approaches. Option A: One message per project, posted sequentially. Each message is self-contained. Option B: One combined message with project sections. Works for 2-3 projects. Beyond that, use separate channels per project.
What about Jira? Jira’s API is comprehensive. Use JQL (Jira Query Language) to filter issues by sprint, status, and date range. n8n has a dedicated Jira node. The sprint burndown data from Jira makes for excellent trend metrics in the automated report.
Can I let team members add notes to the automated report? Yes. Add a “Weekly Notes” column to your project tool or a dedicated Google Sheet. Team members fill in their notes before the report runs. n8n includes these notes in the report. It’s a lighter version of a standup without the meeting.
How accurate are the metrics if people don’t update their tasks? Only as accurate as the source data. If tasks aren’t marked “Done” when complete, the report underreports. This is a process problem, not a tool problem. The automated report actually encourages better task hygiene because discrepancies are visible to the entire team every week.
Should I automate standups too? Asynchronous standups via Slack (what I did yesterday, what I’m doing today, blockers) can be collected via a daily Slack prompt at 9 AM. n8n sends the prompt, collects responses until 10 AM, and posts a summary. This works for remote teams where synchronous standups are impractical across time zones.
Need help implementing this?
Book a free 30-minute discovery call. We'll map your current setup, identify quick wins, and outline what automation can do for your business.
Book a Free Discovery Call